Watch Out For Anomalies!
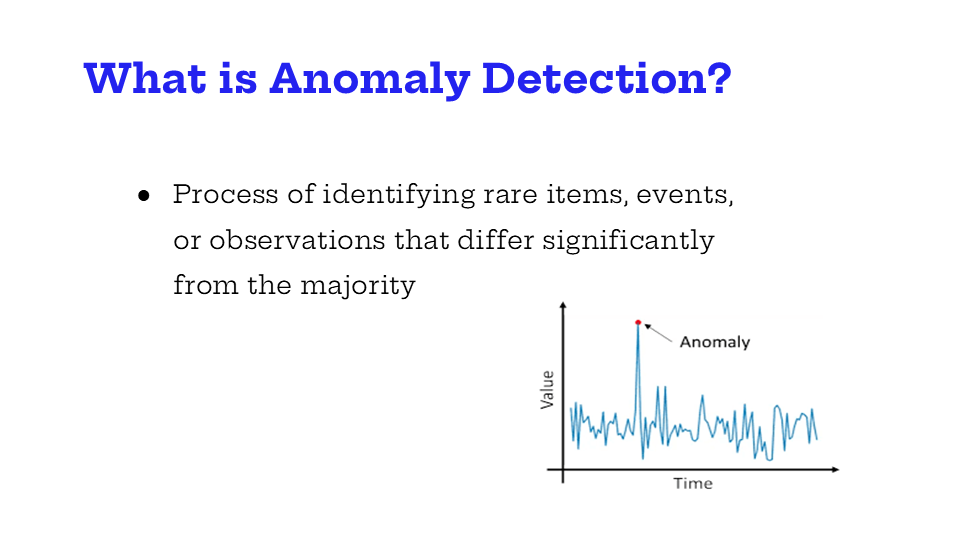
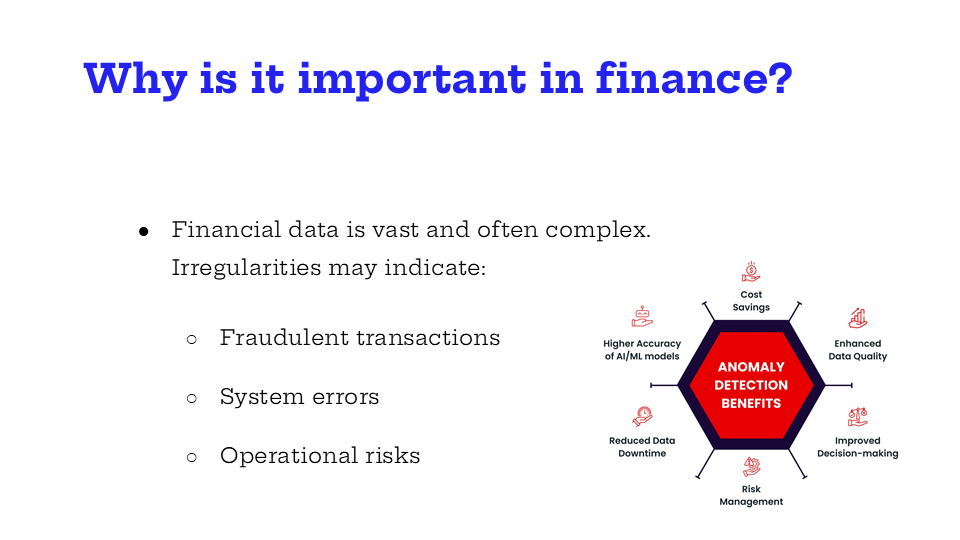
For my Financial Analytics course, I was tasked with researching anomaly detection and presenting our findings to the class. I chose to dive deep into how businesses (especially in finance) use anomaly detection to flag suspicious activity, uncover fraud, and identify irregular patterns in large datasets. It was honestly one of the most interesting topics we covered all quarter.
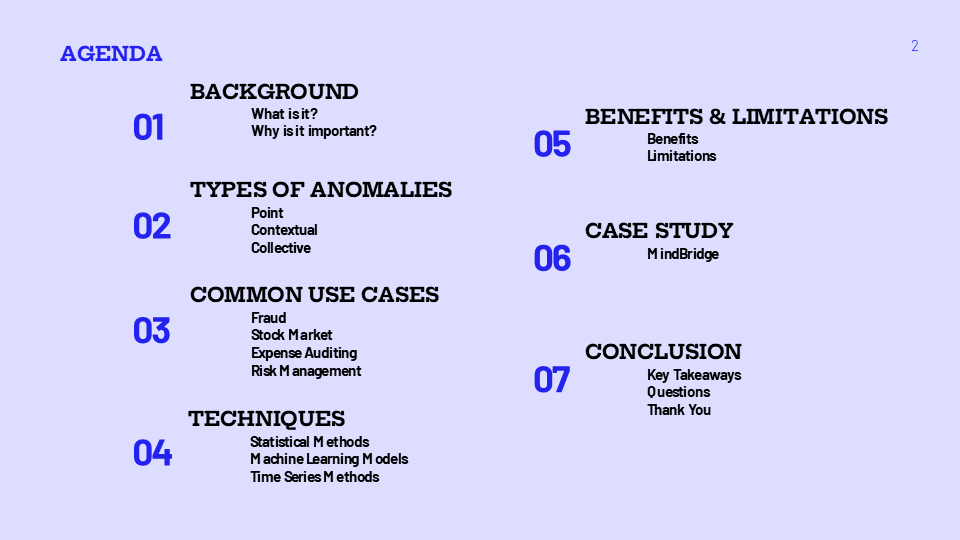
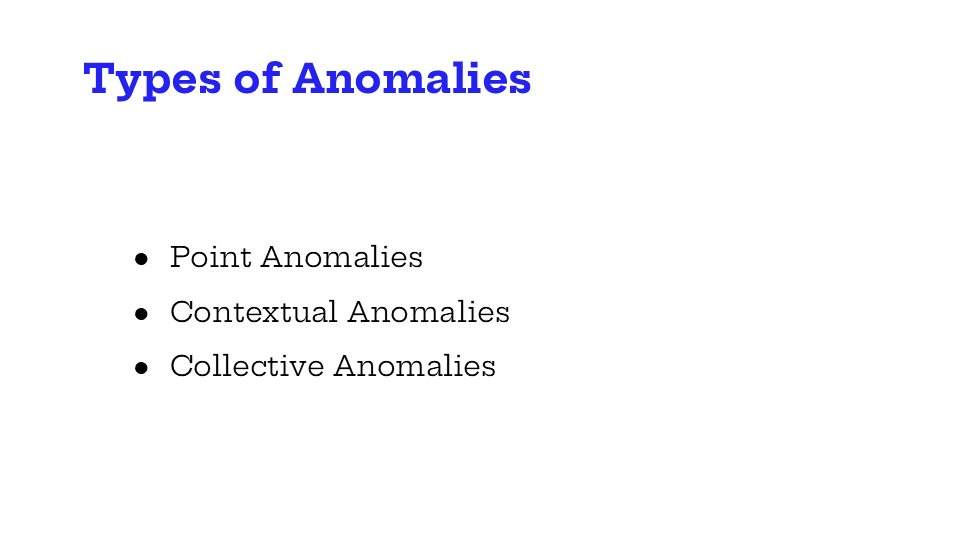
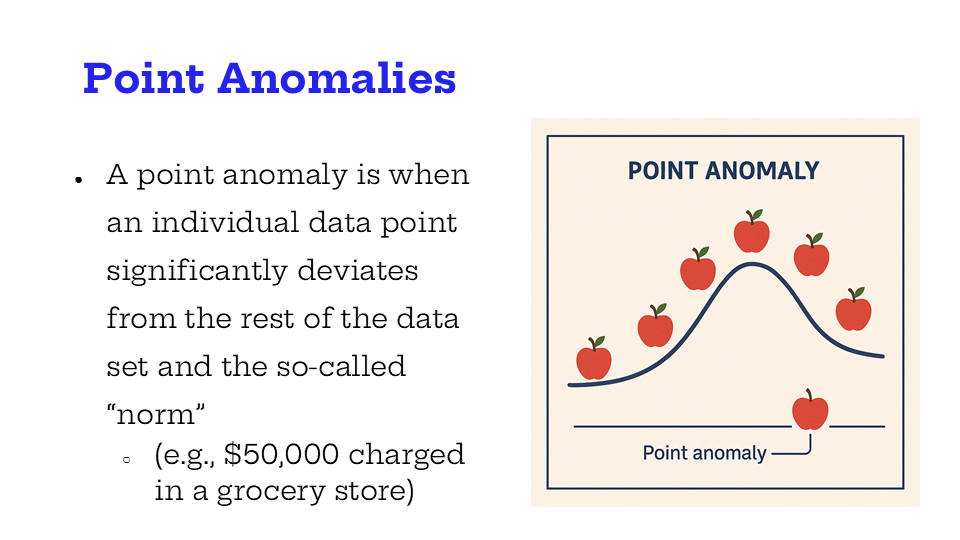
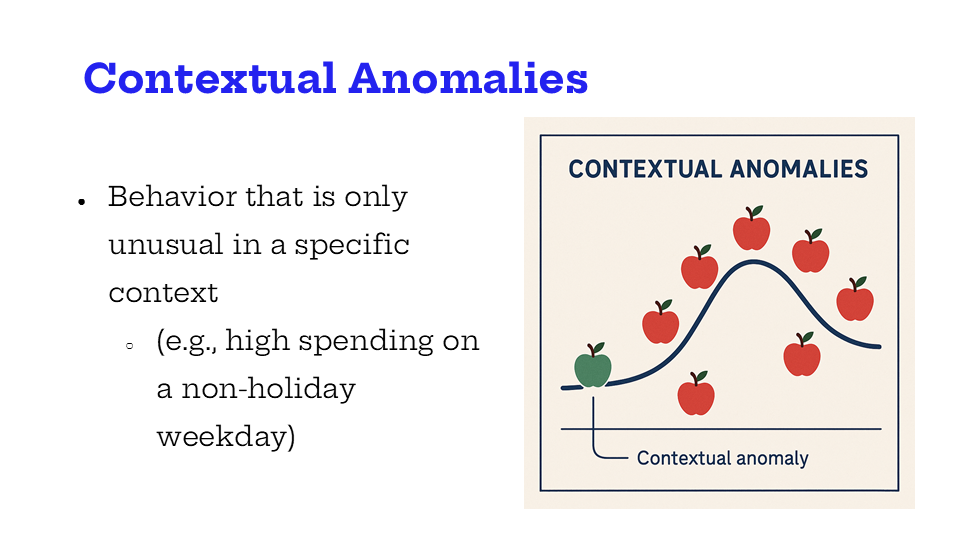
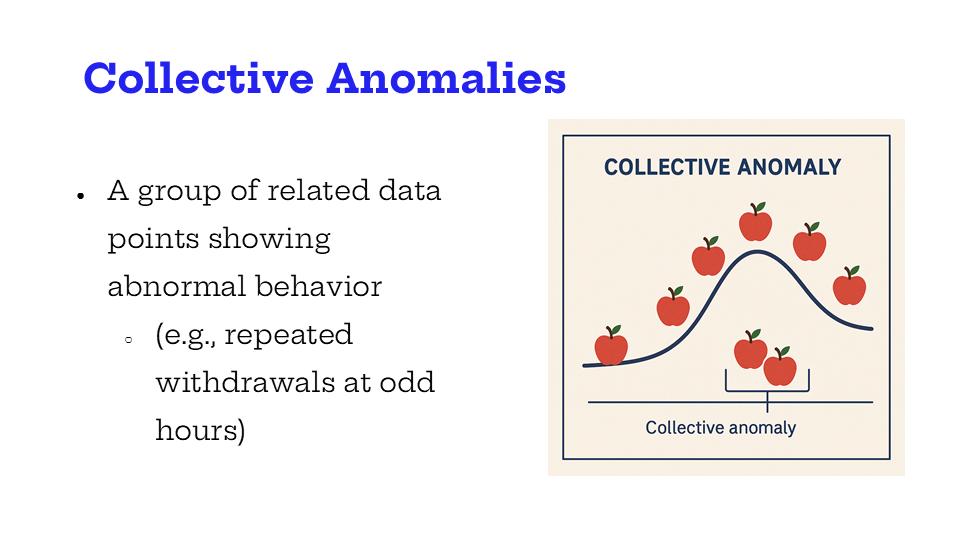
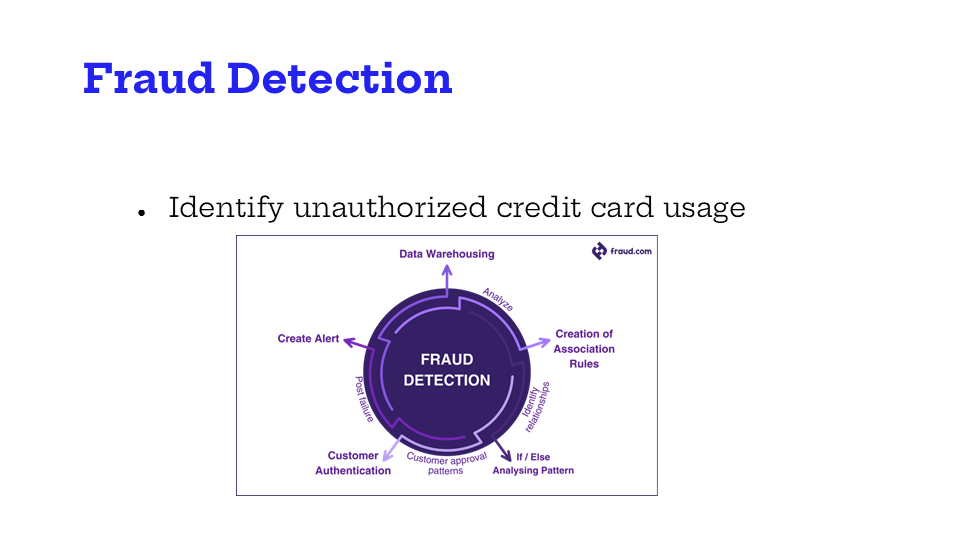
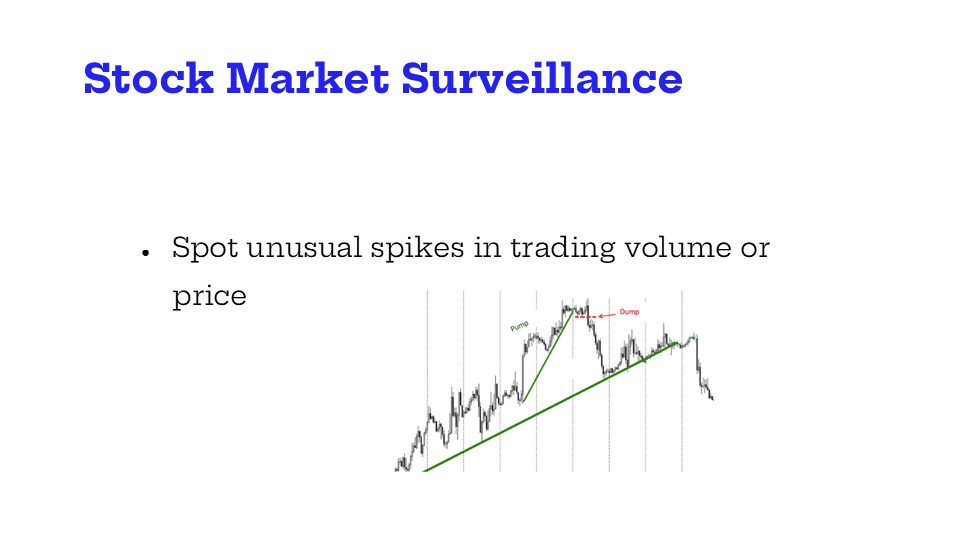
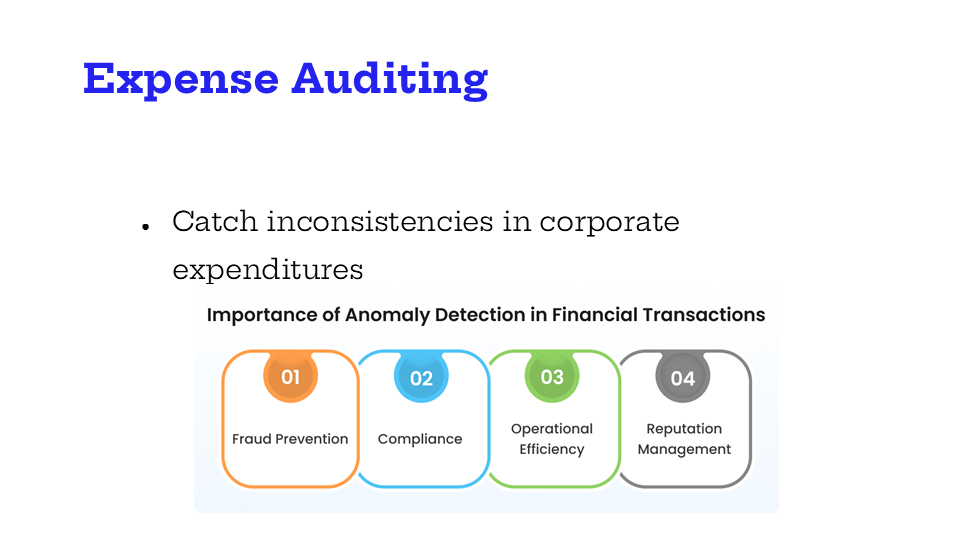
I explored different types of anomalies like point, contextual, and collective, and explained how each one shows up in real-world data. From sketchy transactions to unexpected stock spikes, I wanted to highlight why these “outliers” matter so much in modern finance.
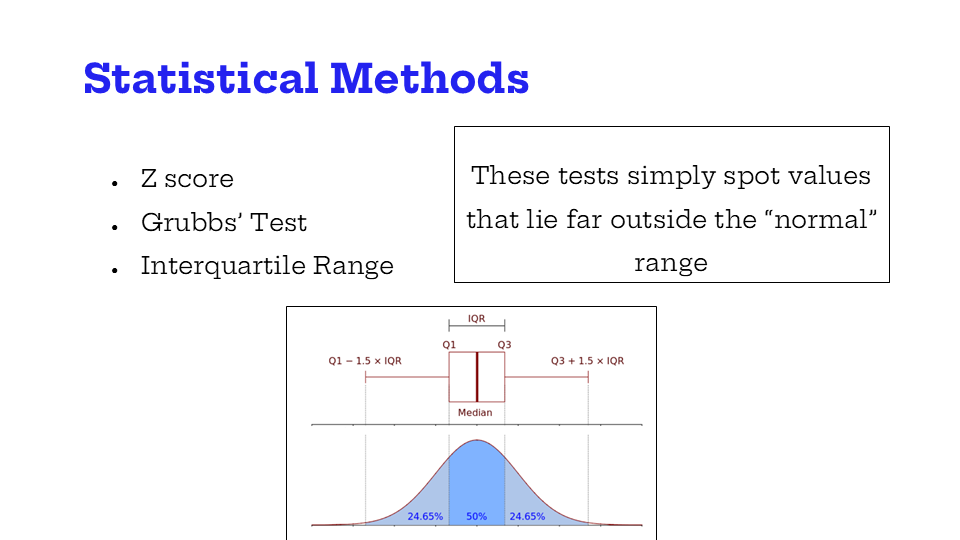
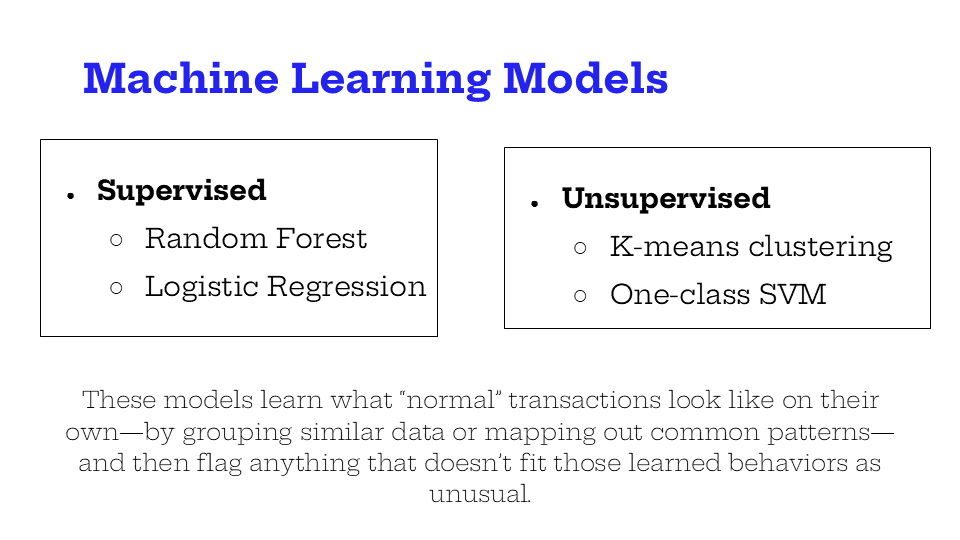
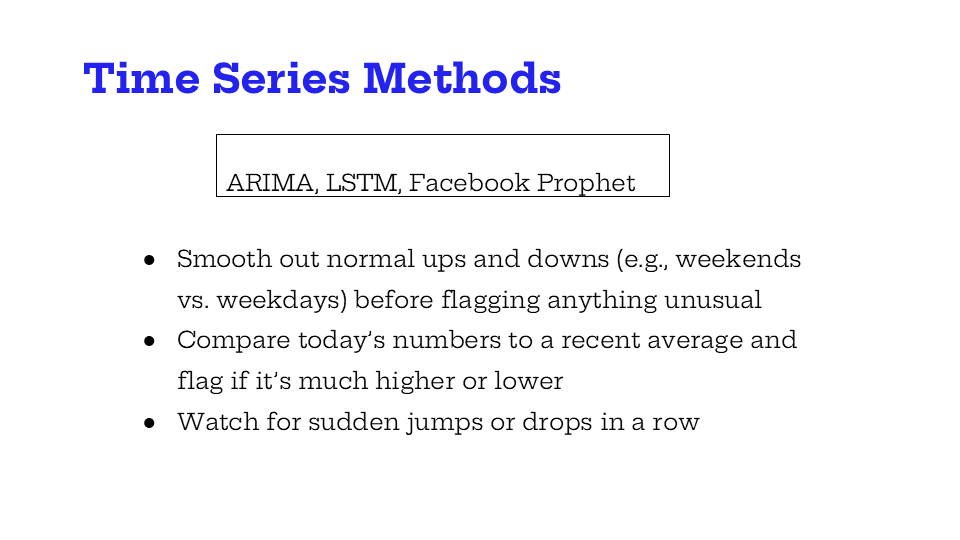
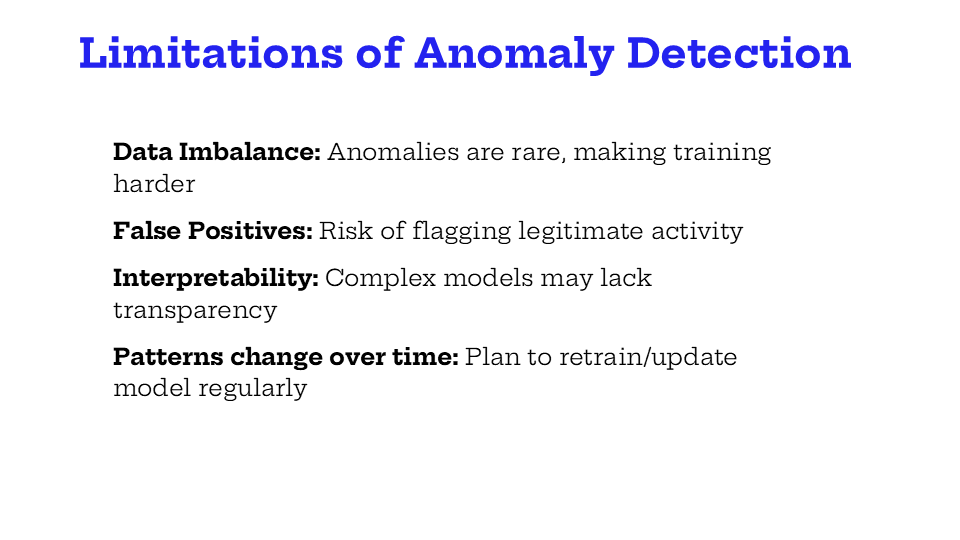
I broke down several detection methods, from basic statistical tools like Z-scores and Grubbs’ Test, to more advanced machine learning models like Random Forest and One-Class SVM. I also touched on time series approaches like ARIMA and LSTM for catching patterns that change over time.
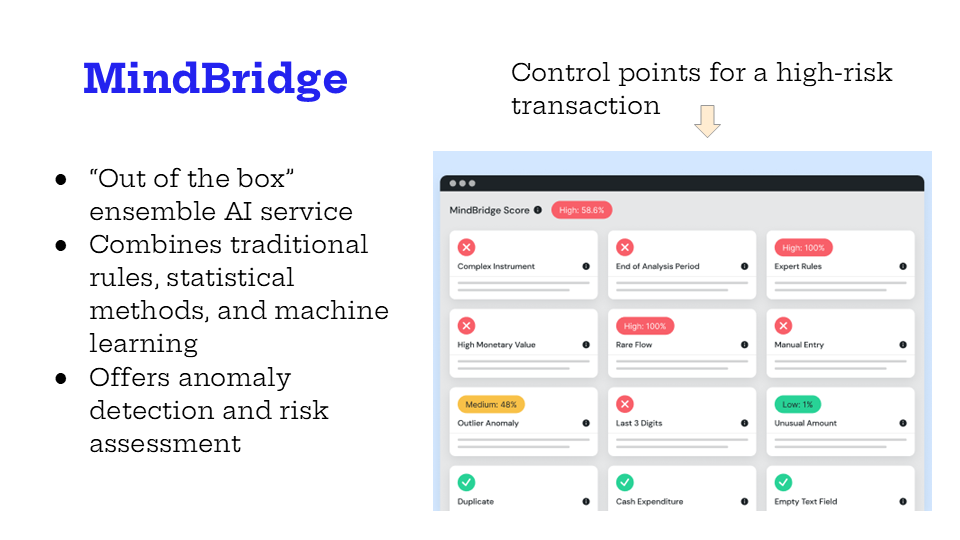
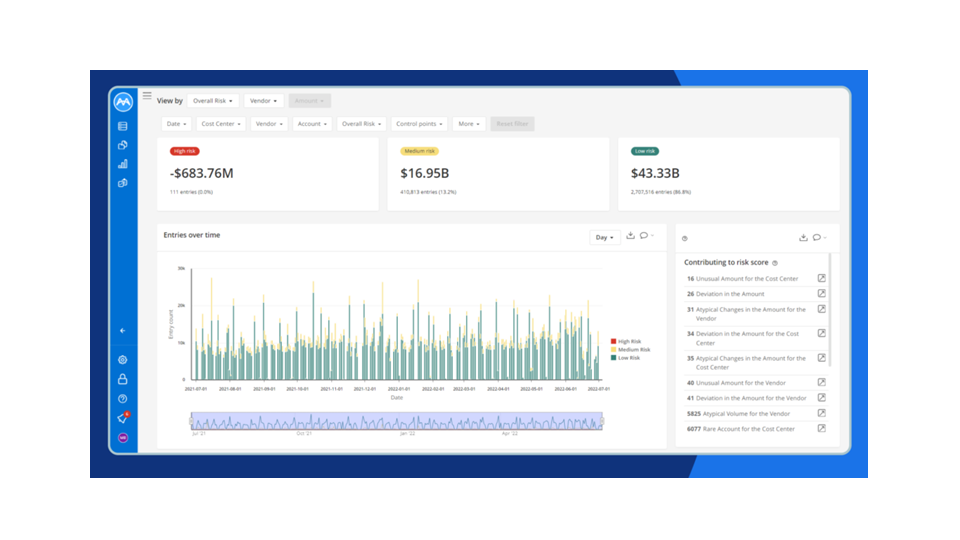
To bring everything together, I featured a real-world case study on MindBridge, a company using AI to automate financial risk assessment. This project sharpened my technical skills, but also helped me practice communicating complex concepts in a way that’s intuitive and easy to follow, which is huge for any analyst or data storyteller. If you’re interested in learning more about anomaly detection in finance and see what I explored, feel free to browse the slide deck below!